



NFL Elo Power Rankings for 2026

It's time for the annual NFL Elo update! The upcoming 2026 season will be my 3rd full season running these Elo power rankings. The new 2026 season power rankings page is now live.
Like last year, during this offseason I've completed a search for a better model, checking for accuracy going back to the 1992 season. I've got more details below.
This season, I will also be submitting the Elo model picks to a straight-up picks pool at nflpickspage.com. Assuming nflpickspage.com is operational for the 2026 season, you'll be able to join for free and compete against the model. It should be fun.
The season pages as they appeared during last season are now available as a new set of "frozen" pages. They capture the ratings and rankings immediately following the Super Bowl in February 2026:
- Regular model "frozen February 2026" pages: 2025, 2024, 2023, 2022, 2021, 2020
- "Blank Slate" model "frozen February 2026" pages: 2025, 2024, 2023, 2022, 2021, 2020
- 2025 Season original "v3-2025-06" model "frozen February 2026" pages: 2025, 2024, 2023, 2022, 2021, 2020
That last category of "v3-2025-06" pages use the model the 2025 season began with. The main pages reverted to the previous year's model after week 17, but I wanted to continue publishing that original model's rankings for anyone interested to see how the season played out with the "v3-2025-06" model.
Looking Back at the 2025 Season
Last year's new automated model search worked really well. I was able to search 10 million models several times over, once each for separate model types. Model "merging" appears to have worked as intended, and was able to find improved models by combining sets of parameters from pairs of models.
The automated model search resulted in a model, called v3.2025.06, that was more accurate than any other model, but... bad parameter search bounds, used in an attempt to reduce the model parameter count by one, resulted in this new model showing unacceptable behavior toward the end of the regular season. To be specific, the model "expected" large margins of victory near the end of the regular season and into the playoffs. This manifested itself as an Elo rating punishment for strong teams that had solid-but-not-blowout victories against middling teams, big Elo exchanges when a strong team lost, and very little Elo exchanged when very strong teams blew out weaker teams. This behavior often leveled the playing field entering the playoffs (effectively giving more benefit to home teams in the playoffs), often lowered the Elo rating of teams that won in the wild card round (effectively giving an Elo advantage to the teams with a wild card bye), and also caused up-and-coming teams that were eliminated early in the playoffs (but not blown out) to be rated more strongly in the beginning of the following season. Together, all these behaviors could explain the accuracy boost. But ultimately, having expected margins of victory that were way too large, and therefore punishing winning teams by taking away Elo rating points (for winning but not having blowout wins) is not aligned with the spirit of Elo ratings.
I had to revert to the 2024 model after week 17.
Fixes for the 2026 Model Search
To fix the bad model behavior described above, I reverted some of the changes I made last year including replacing the removed parameter and fixing the overly wide search bounds.
I also improved how playoff seed clinching is handled with a pair of new parameters (one of which replaces an old parameter). I found that teams are locked into a playoff seeding "category" (either home field, division winner, or wild card) in about 8.2% of games in the final two weeks of the regular season since 2002. Over that span, again just over the final two weeks of the regular season, teams are locked into their exact playoff seed in about 4.5% of those games. Those percentages are substantial enough to warrant special handling, so that's what I've implemented: teams that have clinched a playoff spot and are locked into a playoff seed or "category" are penalized less, Elo-wise, for losing games.
In replacing last year's removed parameter, and adding one net new playoff clinching parameter, I have increased the parameter count by two compared to last year. This drastically increases the running time of the model search. As a temporary workaround to get the model search to finish in a reasonable time, I examined one million fully random models and found good values to set as constants for the two new playoff clinching parameters. I hope to run a full model search later this year, or early next year, without constant values for any parameters.
Tweak to Model Comparison
When examining millions of models, we often have to compare models that pick the same number of game winners. Applying a weighting factor, to make historic seasons less important than more recent seasons, takes care of many of these ties, but we still need further tiebreakers.
One additional new tiebreaker used in this offseason's model search is to compare both models to a benchmark model: we simply count how many seasons the tied models pick more game winners than the benchmark model. This tiebreaker also nicely serves to reward models that have good performance in general rather than lucking into several extremely accurate seasons.
If two models are still tied after looking at "weighted winners" count and the "seasons better than benchmark" count, we apply another new tiebreaker for this year: the picked game winner percentage (also weighted) of the last 10 weeks of the regular season and playoffs, ignoring the final week of the regular season. This tiebreaker appears to essentially be unused in practice, but if needed it would tilt the balance toward models that do better toward the end of the season.
New Model
I'm happy to report that despite searching with constant values for the two new playoff "seed lock" and "category lock" Elo exchange multiplier parameters, and only examining 2.8 million models (vs. 10 million last year), the model search found a new v4.2024.07 model that is slightly less accurate, over the entire Super Bowl era, than last year's misbehaving v3.2025.06 model. If we cherry pick a little, and look at only the last 25 seasons, the new model is slightly more accurate.
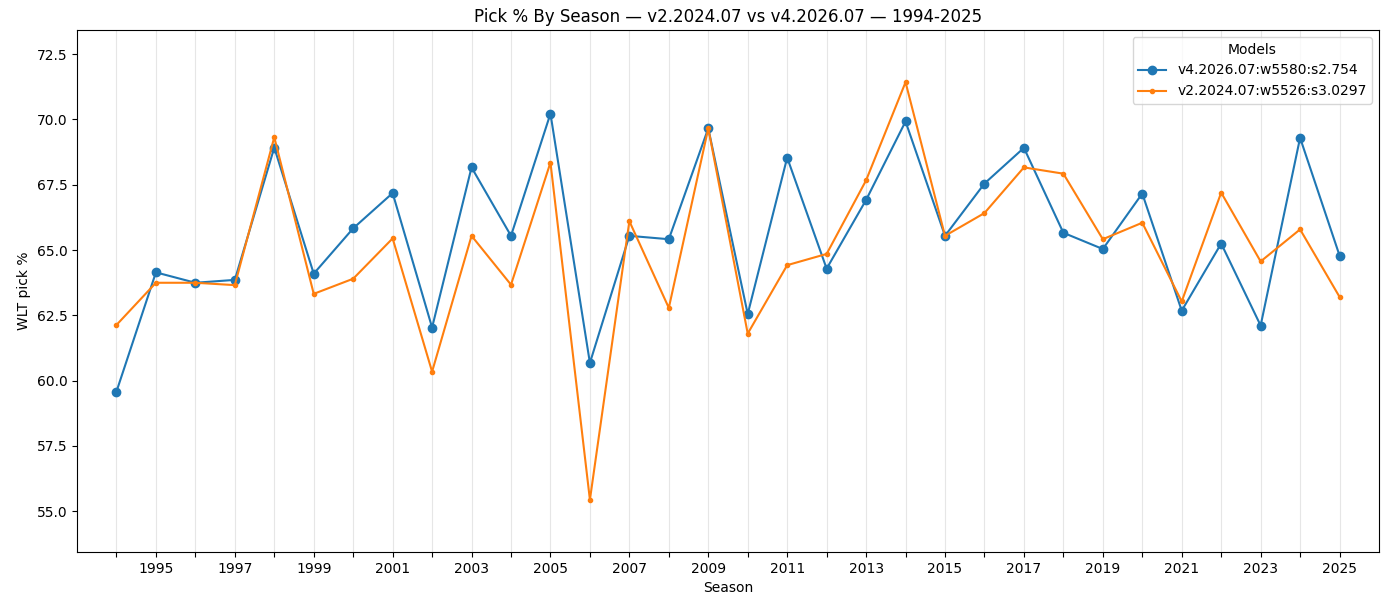
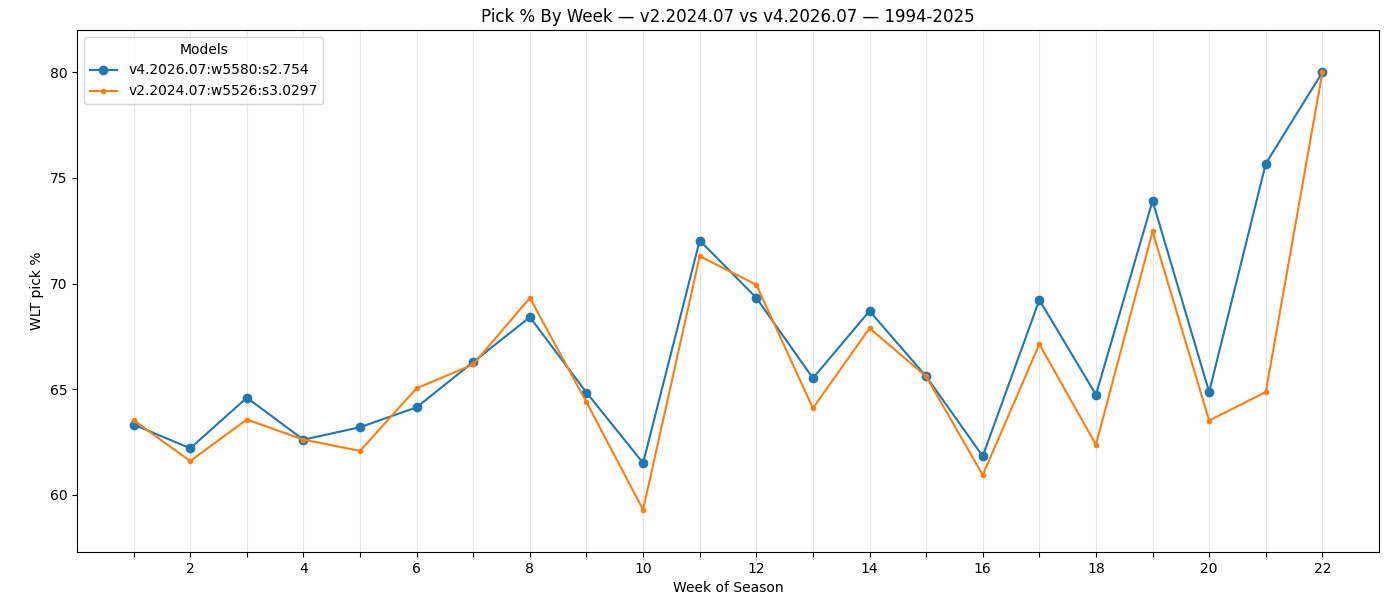
Compared to the v2.2024.07 model used during the 2024 season, and the end of the 2025 season, the new v4.2026.07 model is substantially more accurate. It picks 54 more game winners over the last 32 seasons (the seasons examined during the model search), which is a solid improvement in winner pick rate from 65.03% to 65.67%.
Sometime in the fall I will kick off a new model search, which hopefully will finish in time for next year's offseason work.
Plots by Season and Week of Season
Here are comparisons between last year's the best known (non-misbehaving) model v2.2024.07 and the new v4.2026.07 model. Click the plots to see full size.
The Upcoming 2026 Season
Using the new v4.2026.07 model, let's see which teams have the hardest and easiest schedules. These numbers are based on Elo ratings after the Super Bowl following the 2025 season.
Strength of schedule (easiest=1 to hardest=32), by average opponent Elo rating, for the first 8 regular season games:
- BAL: 1465.75
- CLE: 1467.0
- DET: 1467.17
- NYJ: 1474.65
- TB: 1475.97
- PIT: 1477.74
- GB: 1479.74
- NYG: 1482.71
- NO: 1482.96
- PHI: 1483.92
- MIA: 1487.6
- HOU: 1488.48
- TEN: 1489.69
- CIN: 1490.52
- KC: 1496.78
- SF: 1498.11
- ATL: 1498.96
- NE: 1499.75
- LAR: 1500.03
- IND: 1502.45
- DAL: 1503.72
- LV: 1505.32
- MIN: 1508.02
- SEA: 1512.28
- CAR: 1514.93
- CHI: 1518.38
- JAX: 1528.37
- BUF: 1534.56
- LAC: 1539.16
- DEN: 1540.33
- WAS: 1542.74
- ARI: 1545.54
Strength of schedule (easiest=1 to hardest=32), by average opponent Elo rating, for the last 8 regular season games:
- DEN: 1463.9
- CIN: 1475.28
- WAS: 1477.01
- NO: 1477.24
- ARI: 1479.26
- JAX: 1480.2
- LAC: 1480.28
- IND: 1480.81
- ATL: 1483.29
- CLE: 1483.55
- DET: 1484.38
- BAL: 1487.13
- BUF: 1492.14
- MIN: 1495.31
- TEN: 1497.37
- HOU: 1498.51
- LV: 1503.52
- TB: 1504.43
- SEA: 1505.41
- NE: 1506.42
- KC: 1508.0
- CAR: 1508.73
- PHI: 1514.92
- PIT: 1520.45
- CHI: 1522.87
- NYJ: 1524.88
- DAL: 1525.2
- SF: 1531.11
- GB: 1531.26
- MIA: 1531.83
- LAR: 1533.87
- NYG: 1534.6
Strength of schedule (easiest=1 to hardest=32), by average opponent Elo rating, for the entire 2026 regular season:
- CLE: 1473.07
- NO: 1478.83
- BAL: 1481.15
- DET: 1482.18
- CIN: 1482.96
- ATL: 1489.01
- IND: 1489.51
- HOU: 1490.26
- TB: 1492.19
- JAX: 1495.78
- PIT: 1496.51
- TEN: 1497.24
- PHI: 1497.64
- DEN: 1499.55
- NYJ: 1500.79
- KC: 1500.97
- MIN: 1503.05
- SEA: 1503.22
- NE: 1504.38
- BUF: 1504.58
- NYG: 1505.64
- LV: 1506.1
- CAR: 1507.48
- WAS: 1507.48
- MIA: 1509.57
- GB: 1510.16
- SF: 1511.14
- LAC: 1511.94
- LAR: 1513.44
- DAL: 1514.04
- CHI: 1518.35
- ARI: 1521.82
These "strength of schedule" numbers will of course change quite a bit as the season goes on, so check out the weekly discussions on reddit where these kinds of stats are often revisited.
Changes for 2026 Season
Aside from the new improved model, I've also rearranged some things on the power rankings pages this year. The top of the page is less cluttered, and the table of contents is more compact (especially on mobile devices).
I will no longer be publishing the "blank slate" Elo ratings to reddit, but I will continue post blank slate rankings here. As per usual, I'll be using a special purpose model optimized for the "blank slate" scenario where all teams begin every season rated at 1500. I'm hoping to have a new blank slate model ready in time for week 1, but if not I'll be using an older blank slate model called blank-slate-v1.2024.07.
This section will be updated if any further changes are made during the season.
Update on August 25th: a new blank slate model is ready! I'll be calling it blank-slate-v3.2026.08. This new blank slate model picks 5,454 game winners over the 8,498 games from 1994-2025 (64.19%), which is a nice improvement over the blank-slate-v1.2024.07 model that picks 5,390 game winners (63.43%) over that span. That's an average of exactly 2 more game winners picked per season. This new blank slate model is still inferior to the regular model of course. The new regular model, v4.2026.07, picks 5,580 game winners, averaging 3.94 more winners picked per season than the new blank slate model.
P.S. — You can render the Mandelbrot set image at the top of this post in your browser (desktop recommended) here.